| [ Team LiB ] |
|
5.10 Web Server MonitoringOnce the production system is working, you may think that the job is done and the developers can switch to a new project. Unfortunately, in most cases the server will still need to be maintained to make sure that everything is working as expected, to ensure that the web server is always up, and much more. A large part of this job can be automated, which will save time. It will also increase the uptime of the server, since automated processes generally work faster than manual ones. If created properly, automated processes also will always work correctly, whereas human operators are likely to make occassional mistakes. 5.10.1 Interactive MonitoringWhen you're getting started, it usually helps to monitor the server interactively. Many different tools are available to do this. We will discuss a few of them now. When writing automated monitoring tools, you should start by monitoring the tools themselves until they are reliable and stable enough to be left to work by themselves. Even when everything is automated, you should check at regular intervals that everything is working OK, since a minor change in a single component can silently break the whole monitoring system. A good example is a silent failure of the mail systemif all alerts from the monitoring tools are delivered through email, having no messages from the system does not necessarily mean that everything is OK. If emails alerting about a problem cannot reach the webmaster because of a broken email system, the webmaster will not realize that a problem exists. (Of course, the mailing system should be monitored as well, but then problems must be reported by means other than email. One common solution is to send messages by both email and to a mobile phone's short message service.) Another very important (albeit often-forgotten) risk time is the post-upgrade period. Even after a minor upgrade, the whole service should be monitored closely for a while. The first and simplest check is to visit a few pages from the service to make sure that things are working. Of course, this might not suffice, since different pages might use different resourceswhile code that does not use the database system might work properly, code that does use it might not work if the database server is down. The second thing to check is the web server's error_log file. If there are any problems, they will probably be reported here. However, only obvious syntactic or malfunction bugs will appear herethe subtle bugs that are a result of bad program logic will be revealed only through careful testing (which should have been completed before upgrading the live server). Periodic system health checking can be done using the top utility, which shows free memory and swap space, the machine's CPU load, etc. 5.10.2 Apache::VMonitorThe Visual System and Apache Server MonitorThe Apache::VMonitor module provides even better monitoring functionality than top. It supplies all the relevant information that top does, plus all the Apache-specific information provided by Apache's mod_status module (request processing time, last request's URI, number of requests served by each child, etc.) In addition, Apache::VMonitor emulates the reporting functions of the top, mount, and df utilities. Apache::VMonitor has a special mode for mod_perl processes. It also has visual alerting capabilities and a configurable "automatic refresh" mode. A web interface can be used to show or hide all sections dynamically. The module provides two main viewing modes:
5.10.2.1 Prerequisites and configurationTo run Apache::VMonitor, you need to have Apache::Scoreboard installed and configured in httpd.conf. Apache::Scoreboard, in turn, requires mod_status to be installed with ExtendedStatus enabled. In httpd.conf, add: ExtendedStatus On Turning on extended mode will add a certain overhead to each request's response time. If every millisecond counts, you may not want to use it in production. You also need Time::HiRes and GTop to be installed. And, of course, you need a running mod_perl-enabled Apache server. To enable Apache::VMonitor, add the following configuration to httpd.conf: <Location /system/vmonitor>
SetHandler perl-script
PerlHandler Apache::VMonitor
</Location>
The monitor will be displayed when you request http://localhost/system/vmonitor/. You probably want to protect this location from unwanted visitors. If you are accessing this location from the same IP address, you can use a simple host-based authentication: <Location /system/vmonitor>
SetHandler perl-script
PerlHandler Apache::VMonitor
order deny,allow
deny from all
allow from 132.123.123.3
</Location>
Alternatively, you may use Basic or other authentication schemes provided by Apache and its extensions. You should load the module in httpd.conf: PerlModule Apache::VMonitor or from the the startup file: use Apache::VMonitor( ); You can control the behavior of Apache::VMonitor by configuring variables in the startup file or inside the <Perl> section. To alter the monitor reporting behavior, tweak the following configuration arguments from within the startup file: $Apache::VMonitor::Config{BLINKING} = 1;
$Apache::VMonitor::Config{REFRESH} = 0;
$Apache::VMonitor::Config{VERBOSE} = 0;
To control what sections are to be displayed when the tool is first accessed, configure the following variables: $Apache::VMonitor::Config{SYSTEM} = 1;
$Apache::VMonitor::Config{APACHE} = 1;
$Apache::VMonitor::Config{PROCS} = 1;
$Apache::VMonitor::Config{MOUNT} = 1;
$Apache::VMonitor::Config{FS_USAGE} = 1;
You can control the sorting of the mod_perl processes report by sorting them by one of the following columns: pid, mode, elapsed, lastreq, served, size, share, vsize, rss, client, or request. For example, to sort by the process size, use the following setting: $Apache::VMonitor::Config{SORT_BY} = "size";
As the application provides an option to monitor processes other than mod_perl processes, you can define a regular expression to match the relevant processes. For example, to match the process names that include "httpd_docs", "mysql", and "squid", the following regular expression could be used: $Apache::VMonitor::PROC_REGEX = 'httpd_docs|mysql|squid'; We will discuss all these configuration options and their influence on the application shortly. 5.10.2.2 Multi-processes and system overall status reporting modeThe first mode is the one that's used most often, since it allows you to monitor almost all important system resources from one location. For your convenience, you can turn different sections on and off on the report, to make it possible for reports to fit into one screen. This mode comes with the following features:
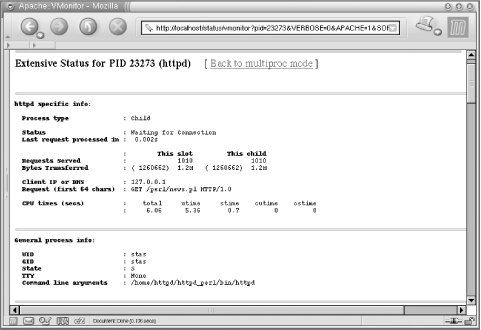
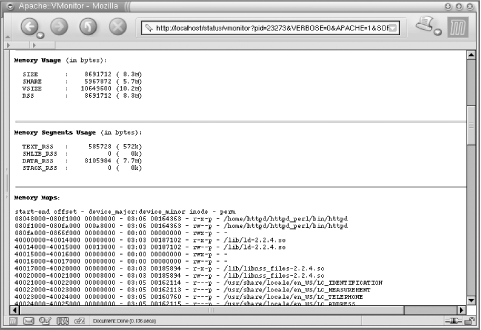
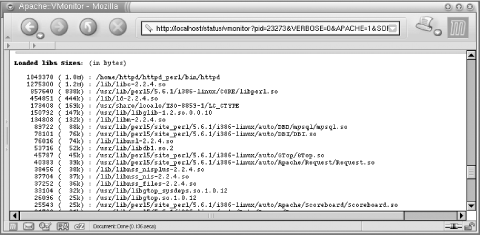
5.10.2.3 Single-process extensive reporting systemIf you need to get in-depth information about a single process, just click on its PID. If the chosen process is a mod_perl process, the following information is displayed:
For all processes (mod_perl and non-mod_perl), the following information is reported:
Just as with the multi-process mode, this mode allows you to automatically refresh the page at the desired intervals. Figures Figure 5-3, Figure 5-4, and Figure 5-5 show an example report for one mod_perl process. Figure 5-3. Extended information about processes: general process information Figure 5-4. Extended information about processes: memory usage and maps Figure 5-5. Extended information about processes: loaded libraries 5.10.3 Automated MonitoringAs we mentioned earlier, the more things are automated, the more stable the server will be. In general, there are three things that we want to ensure:
None of these categories has a higher priority than the others. A system administrator's role includes the proper functioning of the whole system. Even if the administrator is responsible for just part of the system, she must still ensure that her part does not cause problems for the system as a whole. If any of the above categories is not monitored, the system is not safe. A specific setup might certainly have additional concerns that are not covered here, but it is most likely that they will fall into one of the above categories. Before we delve into details, we should mention that all automated tools can be divided into two categories: tools that know how to detect problems and notify the owner, and tools that not only detect problems but also try to solve them, notifying the owner about both the problems and the results of the attempt to solve them. Automatic tools are generally called watchdogs. They can alert the owner when there is a problem, just as a watchdog will bark when something is wrong. They will also try to solve problems themselves when the owner is not around, just as watchdogs will bite thieves when their owners are asleep. Although some tools can perform corrective actions when something goes wrong without human intervention (e.g., during the night or on weekends), for some problems it may be that only human intervention can resolve the situation. In such cases, the tool should not attempt to do anything at all. For example, if a hardware failure occurs, it is almost certain that a human will have to intervene. Below are some techniques and tools that apply to each category. 5.10.3.1 mod_perl server watchdogsOne simple watchdog solution is to use a slightly modified apachectl script, which we have called apache.watchdog. Call it from cron every 30 minutesor even every minuteto make sure that the server is always up. The crontab entry for 30-minute intervals would read: 5,35 * * * * /path/to/the/apache.watchdog >/dev/null 2>&1 The script is shown in Example 5-8. Example 5-8. apache.watchdog --------------------
#!/bin/sh
# This script is a watchdog checking whether
# the server is online.
# It tries to restart the server, and if it is
# down it sends an email alert to the admin.
# admin's email
EMAIL=webmaster@example.com
# the path to the PID file
PIDFILE=/home/httpd/httpd_perl/logs/httpd.pid
# the path to the httpd binary, including any options if necessary
HTTPD=/home/httpd/httpd_perl/bin/httpd_perl
# check for pidfile
if [ -f $PIDFILE ] ; then
PID=`cat $PIDFILE`
if kill -0 $PID; then
STATUS="httpd (pid $PID) running"
RUNNING=1
else
STATUS="httpd (pid $PID?) not running"
RUNNING=0
fi
else
STATUS="httpd (no pid file) not running"
RUNNING=0
fi
if [ $RUNNING -eq 0 ]; then
echo "$0 $ARG: httpd not running, trying to start"
if $HTTPD ; then
echo "$0 $ARG: httpd started"
mail $EMAIL -s "$0 $ARG: httpd started" \
< /dev/null > /dev/null 2>&1
else
echo "$0 $ARG: httpd could not be started"
mail $EMAIL -s "$0 $ARG: httpd could not be started" \
< /dev/null > /dev/null 2>&1
fi
fi
Another approach is to use the Perl LWP module to test the server by trying to fetch a URI served by the server. This is more practical because although the server may be running as a process, it may be stuck and not actually serving any requestsfor example, when there is a stale lock that all the processes are waiting to acquire. Failing to get the document will trigger a restart, and the problem will probably go away. We set a cron job to call this LWP script every few minutes to fetch a document generated by a very light script. The best thing, of course, is to call it every minute (the finest resolution cron provides). Why so often? If the server gets confused and starts to fill the disk with lots of error messages written to the error_log, the system could run out of free disk space in just a few minutes, which in turn might bring the whole system to its knees. In these circumstances, it is unlikely that any other child will be able to serve requests, since the system will be too busy writing to the error_log file. Think bigif running a heavy service, adding one more request every minute will have no appreciable impact on the server's load. So we end up with a crontab entry like this: * * * * * /path/to/the/watchdog.pl > /dev/null The watchdog itself is shown in Example 5-9. Example 5-9. watchdog.pl#!/usr/bin/perl -Tw
# These prevent taint checking failures
$ENV{PATH} = '/bin:/usr/bin';
delete @ENV{qw(IFS CDPATH ENV BASH_ENV)};
use strict;
use diagnostics;
use vars qw($VERSION $ua);
$VERSION = '0.01';
require LWP::UserAgent;
###### Config ########
my $test_script_url = 'http://www.example.com:81/perl/test.pl';
my $monitor_email = 'root@localhost';
my $restart_command = '/home/httpd/httpd_perl/bin/apachectl restart';
my $mail_program = '/usr/lib/sendmail -t -n';
######################
$ua = LWP::UserAgent->new;
$ua->agent("$0/watchdog " . $ua->agent);
# Uncomment the following two lines if running behind a firewall
# my $proxy = "http://www-proxy";
# $ua->proxy('http', $proxy) if $proxy;
# If it returns '1' it means that the service is alive, no need to
# continue
exit if checkurl($test_script_url);
# Houston, we have a problem.
# The server seems to be down, try to restart it.
my $status = system $restart_command;
my $message = ($status = = 0)
? "Server was down and successfully restarted!"
: "Server is down. Can't restart.";
my $subject = ($status = = 0)
? "Attention! Webserver restarted"
: "Attention! Webserver is down. can't restart";
# email the monitoring person
my $to = $monitor_email;
my $from = $monitor_email;
send_mail($from, $to, $subject, $message);
# input: URL to check
# output: 1 for success, 0 for failure
#######################
sub checkurl {
my($url) = @_;
# Fetch document
my $res = $ua->request(HTTP::Request->new(GET => $url));
# Check the result status
return 1 if $res->is_success;
# failed
return 0;
}
# send email about the problem
#######################
sub send_mail {
my($from, $to, $subject, $messagebody) = @_;
open MAIL, "|$mail_program"
or die "Can't open a pipe to a $mail_program :$!\n";
print MAIL <<_ _END_OF_MAIL_ _;
To: $to
From: $from
Subject: $subject
$messagebody
--
Your faithful watchdog
_ _END_OF_MAIL_ _
close MAIL or die "failed to close |$mail_program: $!";
}
Of course, you may want to replace a call to sendmail with Mail::Send, Net::SMTP code, or some other preferred email-sending technique. |
| [ Team LiB ] |
|